In this class you will learn about data visualization. You will learn about best practices for making effective visualizations from data using modern software.
In this class you will also be introduced to some of the modern visualization software tools.
Aesthetics
ggplot
Univariate
Multivariate
Take a look at the ggplot2 website.
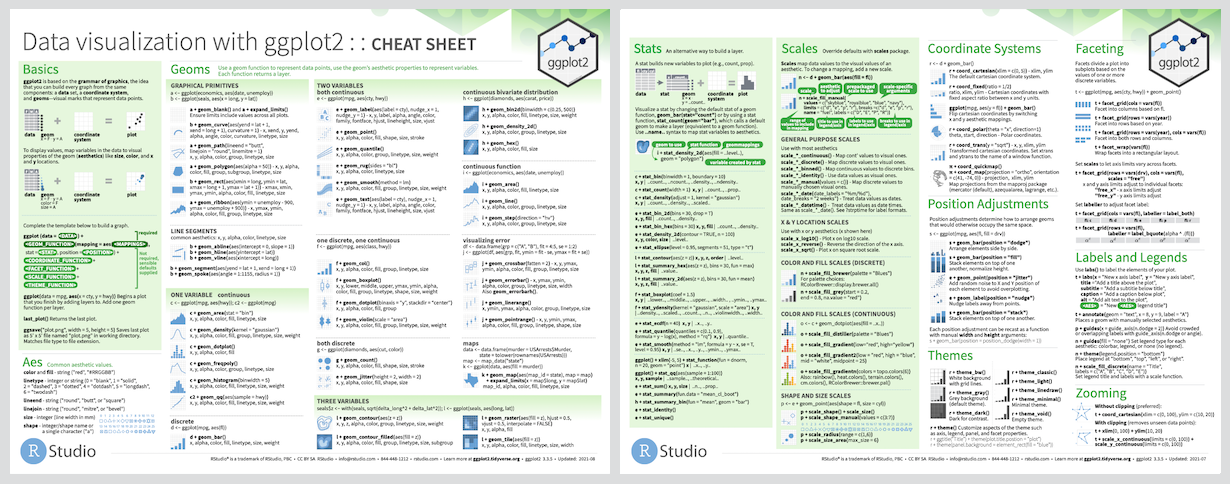
Be sure to download the ggplot2 Cheatsheet.
Here is the link to the ggplot2 extensions website.
Web rich content has brought more color and motion to data visualization.
Working with geolocation data and maps
Distances and routes
Graphs in visualizations.